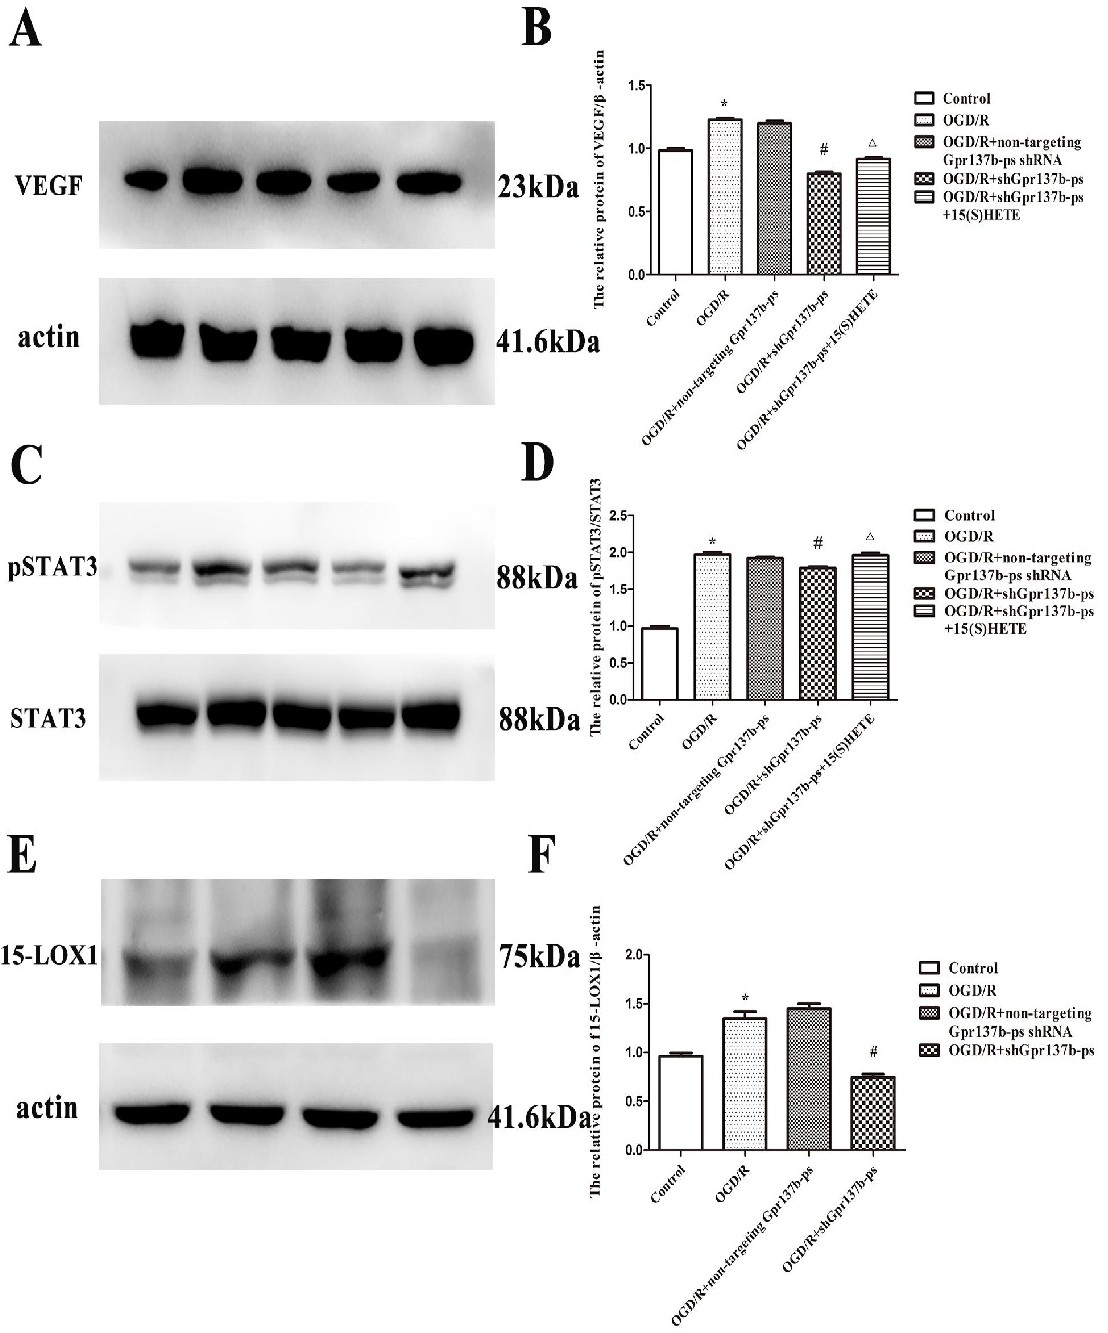
Fig. 8. The relative expression levels of VEGF, pSTAT3 and 15-LOX1 in vitro. (A-D) The protein levels of VEGF and pSTAT3 in cells exposed to control, OGD/R, OGD/R+ non-targeting Gpr137b-ps shRNA, OGD/R+ shGpr137b-ps, and OGD/R+ shGpr137b-ps with 15(S)-HETE. (E-F) The protein levels of 15-LOX1 in cells exposed to control, OGD/R, OGD/R+non-targeting Gpr137b-ps shRNA and OGD/R+shGpr137b-ps (* p <0.05 OGD/R vs control, # p <0.05 OGD/R+shGpr137b-ps vs OGD/R+ non-targeting Gpr137b-ps shRNA, △ p <0.001 OGD/R+shGpr137b-ps +15(S)-HETE vs. OGD/R+shGpr137b-ps). All results are presented as the mean ± SEM.